Sunday, May 9, 2021

Talend Training Detail

Introduction to Data Warehousing

·         Data Warehouse Overview

·         Facts, Dimensions

·         DW models:- Star and Snowflake schemas.

·   Talend Introduction

·         Introduction to Talend

·         Talend Data Integration Overview

·         Talend installation

·         Starting Talend job design and development

·         Repository, Designer and Palette

·         Talend Design


Talend Jobs Designing

·         Types of Components

·         Basic Components - Overview

·         Component Properties

·         Database connectivity components

·         Triggers in Talend

·         Sample Job designing

·         Job Execution

·         Usage of tMap component and other important components from all sections like Processing, Orchestration, File, database etc.

·         Exercises for job development (hands on training)

·         How to Capture information about job execution

·         How to create a table to store monitoring information

·         Detailed Log Generation:

·         Number of records inserted/ updated/ rejected. In case of failure, details of the failed records.

·         Exercises for job development (hands on training)

·         Optimization for running the job


Talend Context and Variables

·         Context Variables - Overview

·         Creation and Usage of Context Variables and Context Groups

·         Dynamic Job designs using Context variables

·         Making database connectivity parameters as job contexts

·         Configuring the job to run it on remote machine

·         Bulk Insert/ Update

·         How to execute the jobs remotely

·         Command line utility and basic and advanced commands

·         How to clean enhance data and reference data

·         How to migrate jobs from DEV to TESTING to PROD environment

·         Case study and hands on development training on the required jobs


Metadata  in Talend.

·         Built-in Connections

·         Shared Connections

·         Source and Destination Connections

·         Database Connections

·         Usage of connections in Job


Logs & Error

·         Logs  and  execution statistics  in Talend

·         Error Handling in Talend

·         Logs & Error Handling Components

·         In case of notification failure Email generation

·         Optimization for running the job


Exercises

·         Real time scenarios on all discussed components

·         Optimization for running the job

·         How to migrate jobs from DEV to TESTING to PROD environment

·         Case study and hands on development training on the required jobs

·         How to run jobs in Linux Environment

·         How to integrate talend jobs with java.

*And also provides resume preparation.

*After this training you can handle any Data Integration (ETL) or Migration projects independently.


Thanks,

Sharad 

mobile -  +91- 9731059957

Email :-  talendetltraning@gmail.com


Tuesday, September 12, 2017

Put File Mask on tFileList Component dynamically in Talend

How I can set file mask for tFilelist component in Talend that it recognize date automatically and it will download only data for desired date?

There are two ways of doing it.
1.    Create context variable and use this variable in file mask.
2.    Directly use TalendDate.getDate() or any other date function in file mask.
See both of them in component
1st Menthod,
·         Create context variable named with dateFilter as string type.
·         Assign value to context.dateFilter=TalendDate.getDate("yyyy-MM-dd");
·         Suppose you have file name as "ABC_2015-06-19.txt" then
·         In tFileList file mask use this variable as follows.
"ABC_"+context.dateFilter+".*"

2nd Menthod
·         In tFileList file mask use date function as follows.
"ABC_"+TalendDate.getDate("yyyy-MM-dd")+".*"


Above are the two best way, you can make changes in file mask per your file names.

LIKE function in Talend

For example there is a column order_payment_method , in which values in other format and you want to change in proper format , for that we have made some business rules as below.


StringHandling.LEN(row1.Order_Payment_Method) >  0 ? 

CommonDb.like(StringHandling.DOWNCASE(row1.Order_Payment_Method),  "%ccavenue-credit_card%")?"CCAvenue_CC":

CommonDb.like(StringHandling.DOWNCASE(row1.Order_Payment_Method),"%credit_card%")?"CreditCard":

CommonDb.like(StringHandling.DOWNCASE(row1.Order_Payment_Method),"%ccavenue%")?"CCAvenue": “N/A”


Here orders of the business rules are very important because if you have noticed there are two categories “credit_card” and “ccavenue-credit_card” so if you interchange the order it will change “ccavenue-credit_card” to CreditCard so you should put “ccavenue-credit_card” first then for “credit_card” same for others.

LIKE is better option if you are not sure what else will be coming with value otherwise you can use .equals() option , in above case you should better use .equals because those categories are fixed.


Best example for using like option is color, like if item name contains black then Black, and if contain “dusk black” then “Dusk Black”
Need to add commonDb code

CommonDb.like(StringHandling.DOWNCASE(main.Item_Name),"%dusk black%")?"Dusk Black":
CommonDb.like(StringHandling.DOWNCASE(main.Item_Name),"%deep black%")?"Deep Black":
CommonDb.like(StringHandling.DOWNCASE(main.Item_Name),"%black%")?"Black"


Generate rows by month for the month between Start Date and End Dates in Redshift


If you run the first only SELECT part which is for the sample data set you will see below dataset.


Sample Data Set :-

item_id start_date end_date monthly_revenue
242345 2/26/2016 7/26/2016        700


Desired Output by month :-

item_id       month  monthly_revenue
242345    2/26/2016 700
242345    3/26/2016 700
242345    4/26/2016 700
242345    5/26/2016 700
242345    6/26/2016 700
242345    7/26/2016 700


Redshift Query to get above data set :-


WITH SampleData AS (
    SELECT
       CAST(242345 AS INTEGER) AS Item_Id
       ,CAST('2016-02-26' AS DATE) AS Start_Date
       ,CAST('2016-07-26' AS DATE) AS End_Date
       ,CAST(700 AS INTEGER) AS Monthly_Revenue
)

,cteTally AS (
        SELECT 0 AS TallyNum
        UNION ALL
        SELECT 1
        UNION ALL
        SELECT 2
        UNION ALL
        SELECT 3
        UNION ALL
        SELECT 4
        UNION ALL
        SELECT 5
        UNION ALL
        SELECT 6
        UNION ALL
        SELECT 7
        UNION ALL
        SELECT 8
        UNION ALL
        SELECT 9
        UNION ALL
        SELECT 10
        UNION ALL
        SELECT 11
    )
    SELECT
        Item_ID,
        DATEADD(MONTH,   c.TallyNum,   t.Start_date) AS "Month",
        Monthly_Revenue
    FROM  SampleData t  INNER JOIN cteTally c
    ON DATEDIFF(MONTH,   t.Start_Date,   t.End_Date) >= c.TallyNum ;

Calculate Cumulative Sum in Redshift - Get sum of values based on previous row

Here in this post I will be explaining you about the query to get the cumulative sum of the rows based on the previous rows. many times you will need to get this for the reporting purpose.

Sample result set :-

itemweekstartcountryregionquantity
AAAA9/11/2017    INIndia
AAAA9/18/2017    INIndia
AAAA9/25/2017    INIndia
AAAA10/2/2017    INIndia2000
AAAA10/9/2017    INIndia3000
AAAA10/16/2017    INIndia
AAAA10/23/2017    INIndia
AAAA10/30/2017    INIndia

Expected Output Result :-


item weekstart country region quantity csum
AAAA 9/11/2017     IN India
AAAA 9/18/2017     IN India
AAAA 9/25/2017     IN India
AAAA 10/2/2017     IN India 2000 2000
AAAA 10/9/2017     IN India 3000 5000
AAAA 10/16/2017     IN India 5000
AAAA 10/23/2017     IN India 5000
AAAA 10/30/2017     IN India 5000


Below is the query which you can use to get the desired output as mentioned above.

Redshift Query :-

SELECT  ITEM,
                WEEKSTART,
                 COUNTRY,
                 REGION,
                 SUM(QUANTITY) OVER (PARTITION BY item ORDER BY item,weekstart,country ROWS UNBOUNDED PRECEDING) AS csum
FROM table_name
ORDER BY ITEM,WEEKSTART,COUNTRY


Friday, February 19, 2016

How to make Salesforce Connection in Talend !!


Salesforce makes revolutionary business applications, served from the cloud, designed to help you generate leads, get new customers, close deals faster, and sell, service, and market smarter. It all adds up to growth, and possibly the need for more office space.

If you are new to Salesforce the go to this link http://www.salesforce.com and make your signup account then login in this.When you are logged in then you will see this window.


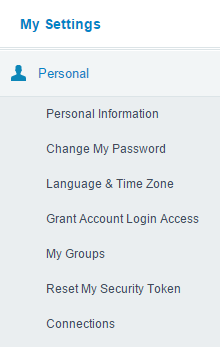
Now inside your profile name on the right side of the window you will these four options click on My Settings tab.


Now to get Security Token in My Settings window on the click on left side under your Personal tab
click on Reset My Security Token option.You will get security token on your email.
 

Now to make connection in Talend go to your Talend.

In the Repository tree view,under the Module section right click on the Salesforce and select
Salesforce Connection from the pop-up menu.


This window will come fill information in the new salesforce, such as Name, Purpose and Description.Then click on Next button.


Now here we have setup a connection to salesforce account.So follow the steps given below.
The Salesforce Web service URL displays by default in the Web service URL field.
Enter the username such as youremail@yourcompany.com
Enter the password.When you are entering password here you should concatenate the password and security token both values.
Click on Check Login button to see whether your connection to salesforce is successful or not.

When you click on Check Login button this window will be seen.
If your logins are correct the this window appear with message Connection Successful.


Click on Finish button to close the wizard.

Now go under the Metadata Section >Salesforce here you can see that your connection has been made.


In this way by following the above you can make Salesforce Connection in Talend.

Wednesday, August 5, 2015

Difference Between OnSubjobOk and OnComponentOk

The difference between OnSubjobOk and OnComponentOk lies in the execution order of linked subjob.

With OnSubjobOk, linked subjob starts only when the previous subjob completely finishes.
We should use OnSubJobOk when there are many jobs linked to each other and next subjob should be trigger only once the previous subjob is completed.

We can also use OnSubJobError to send any notification email incase of any job failure which will
help you to identify the job which has failed.

You can also use tDie component with on subjoberror trigger which will kill the process incase of any subjob failure.

With OnComponentOk, linked subjob starts when the previous component finishes.
OnComponentOk

On OnComponentOk trigger next component will trigger once the previous component is finished.

It is very difficult to say where to use both but based on your requirement both can be used.

Tuesday, June 23, 2015

How to use UnpivotRow component in Talend !!

In this post I will show you how to convert columns to multiple rows.  Step by Step post will help you to follow the steps to convert columns to rows in case if you get the input data as per the below
format.


This is Institution Input File:-
Intitution_ID;Intitution_Name;Address;City;Country;Course_1;Course_2;Course_3
101;NIIT;722 Bur Oak Avenue;Berlin;Germany;CS;EE;EC
102;AIIM;11 Collaroy 2093;Medrid;Spain;MBA;BBA;BCA
103;SRIT;223 Wellington 5011;London;UK;BSC;ME;MTECH

There is a specific talend component inbuilt for this purpose which will convert the columns to rows based on the key ID. Just follow the steps and you will be able to achieve your desired output.

Search for the tUnpivotRow component in the pallete area and Drag and drop the following components from the palette tFileInputDelimited,tUnpivotRow, and tLogRow.


Open the component properties of tUnpivotRow .
Click on Edit schema button, columns will be same as in the input file but in tUnpivotRow_1(Output) there will be one pivot key and pivot value column.And we want one more column to appear in output i.e Institution_ID so add it by clicking + button.


In the Row keys field if you want Institution_ID as a key i.e ID should be displayed for all the institutions so add it by clicking on + button.


When you Run the job excluding Institution_ID columns all other columns will be multiplied by 3 rows i.e there will be 3 rows * 7 columns = 21 rows will appear in the output.

Starting job how_to_use_unpivot at 14:41 21/05/2015.

Now after running the job you should be able to see the desired output in the screen as per below format, for the proper view you can choose the "table(print values in cells of a table)" which will print all the rows in proper table format.


[statistics] connecting to socket on port 3454
[statistics] connected
.----------------+--------------------+---------------------------.
|                               tLogRow_1                                       |
|=---------------+--------------------+-------------------------=|
|pivot_key            |pivot_value                |Institution_ID  |
|=-------------------+-------------------------+----------------=|
|Institution_Name|NIIT                            |101                 |
|Address               |722 Bur Oak Avenue  |101                 |
|City                     |Berlin                          |101                 |
|Country               |Germany                     |101                 |
|Course_1             |CS                               |101                 |
|Course_2             |EC                               |101                 |
|Course_3             |EE                               |101                 |
|Institution_Name|AIIM                           |102                 |
|Address               |11 Collaroy  2093       |102                 |
|City                     |Medrid                         |102                |
|Country               |Spain                           |102                |
|Course_1             |MBA                           |102                |
|Course_2             |BBA                            |102                |
|Course_3             |BCA                            |102                |
|Institution_Name|SRIT                            |103                |
|Address               |223 Wellington  5011  |103               |
|City                     |London                         |103               |
|Country               |UK                               |103               |
|Course_1             |BSC                             |103               |
|Course_2             |ME                               |103               |
|Course_3             |MTECH                       |103               |
'---------------------+--------------------------+----------------'
[statistics] disconnected
Job how_to_use_unpivot ended at 14:41 21/05/2015. [exit code=0]

Monday, June 22, 2015

How to convert rows to columns using tPivotToColumnDelimited component in Talend !!

In this post I will show you how to convert rows to columns using tPivotToColumnsDelimited . 
It requires at least three columns in the input schema: the Pivot column, the Aggregation column and one or more Group keys.

This is Institution Input File:-

Intitution_ID;Intitution_Name;Intitution_Address;Intitution_Course;Institution_CourseName
101;IT;722 Bur Oak Avenue  Berlin Germany;Course1;CS
101;IT;722 Bur Oak Avenue  Berlin Germany;Course2;EE
101;IT;722 Bur Oak Avenue  Berlin Germany;Course3;EC
102;AIIM;11 Collaroy  2093 Medrid Spain;Course1;BCOM
102;AIIM;11 Collaroy  2093 Medrid Spain;Course2;BBA
102;AIIM;11 Collaroy  2093 Medrid Spain;Course3;BCA          
103;SRIT;223 Wellington  5011 London UK;Course1;BSC
103;SRIT;223 Wellington  5011 London UK;Course2;ME
103;SRIT;223 Wellington  5011 London UK;Course3;MTECH

Drag and drop the components from the palette and connect each of them as shown in the blow screenshot.

Configurations setting of the tPivotToColumnsDelimited  component :
Pivot Column =”Type”
Aggregation column=”Value”
Aggregation Function =”last”
Group by “ID” and “Name” column.
Rest of the configuration is for output file, where our output will be transferred. to read output file we can use either delimited component but for quick review I`ll use tFileInputFullRow.
Add tFileInputFullRow below the tFixedFlowInput component and connect with “On Sub Job Ok” trigger. and provide previously created file path and rest of the details.
add tLogRow and connect to tFileInputFullRow component and execute the job you will get above out put on console.
Final Job Design.


Open the component properties of tPivotToColumnDelimited.

Pivot Column – In order to convert rows to columns, we need to identify a one column which need to be converted to multiple columns based on Aggregate column. 
In this we want to convert Institution_Course to multiple column so select Institution_Course in Pivot column field.

Aggregate column  - Aggregation column is the column from source data on which aggregation is to be applied with specific function.
Aggregation column is Institution_CourseName here we want aggregate the course name.

Aggregation function – which type of aggregation is to be applied on input data. If no aggregation function is applied, then you can select “First”. Aggregation functions available are Sum, Count, Min, Max, First, Last. Select the Aggregation function first.

Group by – You need to provide a group by column name, this is the column based on which pivot columns are created. Select Institution_ID, Institution_Name, Institution_Address.These columns we want to be grouped by pivot column.

Give the File Name path where you want to store the data.

Open the component properties of tFileInputFullRow.
Provide the File Name path where you want to store the data.

Click on Edit schema button this schema will be shown as below.


In tLogRow component select Table(print value in cells of table) option so that result will appear in table format.

Run the job you will see all the Institution_CourseName are grouped together with Institution_ID, Institution_Name, Institution_Address.
We have 9 rows in input and 3 rows as output .

Starting job how_to_tpivottocolumn at 15:16 21/05/2015.

[statistics] connecting to socket on port 4080
[statistics] connected
.--------------------------------------------------------------------------------------.
|                            tLogRow_1                                                                    |
|=-----------------------------------------------------------------------------------=|
|line                                                                                                             |
|=-----------------------------------------------------------------------------------=|
|101;IT;722 Bur Oak Avenue  Berlin Germany;CS;EE;EC                       |
|102;AIIM;11 Collaroy  2093 Medrid Spain;BCOM  ;BBA;BCA            |
|103;SRIT;223 Wellington  5011 London UK;BSC ;ME;MTECH           |
'--------------------------------------------------------------------------------------'
[statistics] disconnected
Job how_to_tpivottocolumn ended at 15:16 21/05/2015. [exit code=0]